Causes of Zoophilia - A 2000 Survey: Difference between revisions
m The LinkTitles extension automatically added links to existing pages (<a rel="nofollow" class="external free" href="https://github.com/bovender/LinkTitles">https://github.com/bovender/LinkTitles</a>). |
No edit summary |
||
| Line 132: | Line 132: | ||
The above table shows the responses to this question by gender. From these figures it's clear that male respondents appear to have a lesser self image of themselves than female respondents, though I suspect this is quite normal. | The above table shows the responses to this question by gender. From these figures it's clear that male respondents appear to have a lesser self image of themselves than female respondents, though I suspect this is quite normal. | ||
What was found from analysis of this question is that no single factor seems to have a major impact on self image, though species preference (those attracted to prey animals have a better self image than those attracted to hunter animals), sexual orientation (bestialists have lowest self-image, followed by zoophiles then non-zoophiles) and the number of current pets (respondents with no pets have significantly lower self-image than those with more than three pets) seem to have the greatest impact. | What was found from analysis of this question is that no single factor seems to have a major impact on self image, though species preference (those attracted to prey animals have a better self image than those attracted to hunter animals), [[sexual orientation]] (bestialists have lowest self-image, followed by zoophiles then non-zoophiles) and the number of current pets (respondents with no pets have significantly lower self-image than those with more than three pets) seem to have the greatest impact. | ||
Other factors which have a less significant impact on self image are age and human relationships. Respondents aged below 20 and above 40 seemingly with highest self image, and those at 28 with lowest. Also, respondents in a human relationship are significantly less likely (almost five times so) to rate their self image as negative, and 25% more likely to rate their self image as positive; but I suspect this is quite an obvious point. | Other factors which have a less significant impact on self image are age and human relationships. Respondents aged below 20 and above 40 seemingly with highest self image, and those at 28 with lowest. Also, respondents in a human relationship are significantly less likely (almost five times so) to rate their self image as negative, and 25% more likely to rate their self image as positive; but I suspect this is quite an obvious point. | ||
| Line 178: | Line 178: | ||
This article is the very nice work of Muse's Zoo Research and can be read here in it's full context. | This article is the very nice work of Muse's Zoo Research and can be read here in it's full context. | ||
[[Category:Surveys]] | |||
Revision as of 18:56, 9 April 2023
This is a survey that was taken from the old zoophilia.net website and is to show how far the survey relating to Zoophilia has progressed through the years.
Introduction
A brief word of introduction. The following document is in no way official, and these figures should not be taken as universal fact. There are doubtless many factors that I've not accounted for, which significantly affect the data. Also, the word zoophilia has been used throughout. When I say zoophilia I am likely actually referring to both zoophilia and bestiality. Also worth note is that the graphs here are merely to give a visual indication of the data (which is usually also summarised in a table) and so they have been made as compact as possible. Because of the difference between the number of male and female respondents, graphs which give a comparison between the two genders have used percentages instead of absolute figures, as indicated. But again, the absolute figures are typically also given in table format.
This version of the document was compiled on the 12th May 2000, at which point the total number of respondents stood at 186.
Gender
Not surprisingly, the vast majority of survey respondents were male. In fact 85%, over four fifths, of survey respondents were male. This is significantly different to figures found in other web surveys, most being around 60% (Survey.net, 2000). This could indicate that males are more likely to find and respond to this survey, or that gender has some minor effect on the prevalence of zoophilia or bestiality.
(IMAGE)

Approximate age
A graph showing the approximate age of respondents by gender. Here again, it is no surprise to find that the majority (51.61%) of 'net users are under 30. This fits in with other surveys, which show the figure to be around 51% (Survey.net, 2000). This portion has fallen significantly from the survey as it stood 16 months ago, at which time 57.14% of respondents were under 30. Also the portion of respondents over 50 has risen from 1.9% to 4.3%.
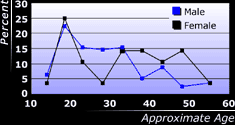
These changes over time aside, the only really notable fact illustrated by these figures is the difference between the two genders. For some reason the average age of male respondents was 32.1, while for females the age was 28.7, a difference of 3.4 years. As predicted this figure has fallen from the previous survey 14 months ago, when it was 5 years. But still there's the possibility that females are more pressured to be 'normal' at a young age, and so may develop zoophilia or bestiality at a later stage of life.

Age when first realized zoophilia/bestiality
A graph showing the age respondents realised their zoophilia or bestialityThe explanation I gave earlier for the difference between the ages of male and female respondents is illustrated perfectly here. The peak age at which females realise/decide their zoophilia or bestiality is 15 to 18, while for males this figure is between 12 and 14. The figure for males matches the approximate age that they go through the initial stages of puberty. For females, who go through puberty two years earlier, the age at which they realise their zoophilia should be similarly earlier. That it is later indicates perhaps some social or other similar pressure affecting their decision. In addition to this later peak in ages, there's also a wider spread of ages, with a greater portion of females realising their zoophilia or bestiality at ages under 11, between 15 and 30 and between 41 and 50, than men. I can't think of any obvious reason behind this, though social attitudes towards women and sexuality perhaps give a greater freedom than for men.

Sexual orientation
The two graphs below show the sexual orientations of males and females; both actual orientation, and to what gender(s) that orientation applies. It is worth noting that the same person can be multiple orientations. For example a person can be both a zoophile and a human bisexual, while occasionally being a bestialist.
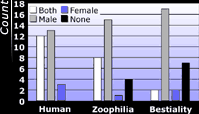
The first, and most striking, difference between the two graphs is that females are on the whole far more heterosexual, where animals are concerned. The reasons for this are quite obvious, when certain physiological factors are considered. However, there are other differences more difficult to explain. For example, it seems there are slightly fewer bestial males (73%) than females (75%), something often rumoured the opposite. Interestingly, for the first survey these figures were 68% and 79% respectively. Also, in males so called "zoo exclusiveness" seems far more prevalant than in females, with all 28 female respondents so far being in some way interested in humans, and only 80% of males being of a similar attitude.
However, here we have the first marked difference between zoophiles and non-zoophiles. 34.2% of zoophiles or bestialists are bisexual with regards to humans, while non-zoos are bisexual only XXX% of the time. This is perhaps the result of a general acceptance of anything beyond human heterosexuality being more prevalant in zoophiles, or as I once heard it put, once one social boundary has been crossed the next is easier.

Species preference
A graph showing the species preference of male respondents. The graph to the left shows the ten most popular species amongst males. Not surprisingly, dogs and horses feature as the two most prominent species. It is interesting to note how different the preferences people have for different animals are, for example between cattle and wolves. The reason behind this is likely impossible to explain, though it could be something to do with the connections between the most popular species (dogs and horses) and similar species, such as wolves and cattle.
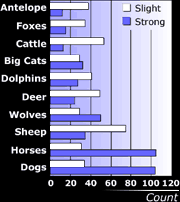
The figures that do not appear on this graph are those for bears (8 strongly attracted, 25 slight), birds (2 strong, 8 slight), llama (13 strong, 29 slight), pigs (14 strong, 31 slight), rabbits (4 strong, 6 slight), racoons (5 strong, 7 slight), mustelids (1 strong, 11 slight) and others (including giraffe, gazelles, seals, elephants, monkeys, house cats and snakes).
A graph showing the species preference of female respondents. To the right is a graph showing the ten most popular species amongst females. Again it is no surprise to see dogs and horses featuring as the most popular. However, what is remarkable is that over 84% of females are strongly interested in dogs, while for males the figure is only 67%. Again, biological factors likely come into play here. These same factors might also explain a lesser attraction to horses in females than in males.
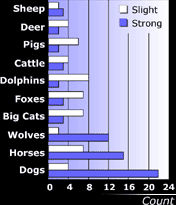
Again it's interesting to see how different the attractions to the different species are. For example with wolves, 12 respondents are strongly attracted to them, 2 slightly attracted and all remaining 14 respondents not at all attracted.
The figures that do not appear on this graph are those for Antelope (1 strongly attracted, 1 slightly), bears and racons (both 1 strongly, 3 slightly), birds (3 strongly), llama (2 strongly, 2 slightly), rabbits (1 strongly, 2 slightly), mustelids (2 strongly, 1 slightly) and others (including snakes, eels and house cats).
Upbringing
The only open question, this question looking at a person's upbringing is one of the most difficult to analyse. The reasons for this are twofold; because it is a qualitative question (not quantitative, as is for example age) and because it is difficult to make comparisons to any normal. So I've taken a look at the responses and tried to broadly categorise some of these. The results of this categorisation are shown in the following table.
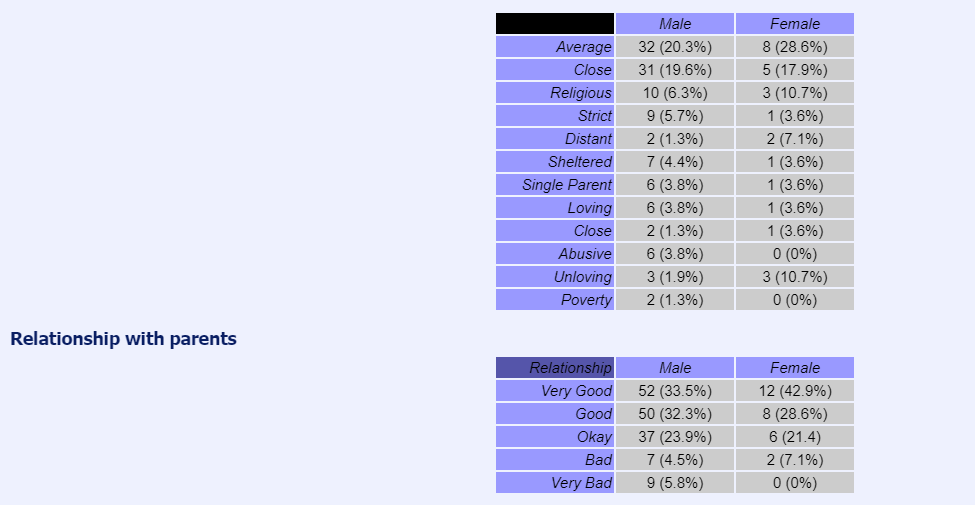
The above table shows a summary of the relationships respondents have had with their parents. An interesting point here is quite how positive people seem to be with regards to their upbringing, over 90% rating their upbringing okay, good or very good while an expected statistical mean would be 60%. This is a question that I am particularly interested in finding some 'model' data to compare it to. However, I suspect that this positive attitude will be mirrored through the whole 'net population.
Unfortunately, the data collected here isn't really sufficient in volume for much comment to be made on the differences between males and females. It does seem that males report worse upbringings than females, with 71.4% of females having a good or very good upbringing, the figure for males being only 65.8%. These figures have converged slightly since the last analysis though, when they were 73.7% and 65.8%.
Parent's knowledge of sexual orientation
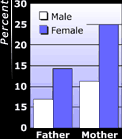
The graph to the left shows what percentage of respondents have told their parents of their zoophilia, and which parents. What is straight away clear is that females are far more, almost two times more, likely to have told their parents of their sexuality. It's also clear that people are more comfortable telling their mother of their sexuality than their father. Of course, this question does not look at how their parents found of their zoophilia. I'm quite sure that in many cases one parent is told, and this is passed on to the other. I'm currently considering ideas for a future survey looking more specifically at this matter, either zoophilia and family, or 'coming out' experiences.
A graph showing the year respondents told their parents.
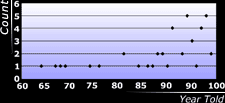
The graph to the left shows a scatter-plot of when respondents who had told a parent of their zoophilia did so. While it may seem that people are far more willing to tell their parents of their zoophilia today than they were twenty years ago, it's worth noting the ages of respondents; 20 years ago almost half of survey respondents were not even ten years old!
However, even taking this into consideration the data is definitely showing a greater acceptance of zoophilia within the family environment. Over the past twenty years 36 respondents have told a parent of their zoophilia. Over the twenty years prior only 7 people did so.
It's also worth noting that the two highest figures so far are 1994 and 1998. It is possible that this sudden increase is due to the 'net, and the availability of information pertaining to zoophilia. It was only a few months after I got onto the 'net and discovered I was not alone with this sexuality that I told my parents of my zoophilia. Certain individuals have actually dubbed this "zoophoria", an illustration of just how usefully versatile the abbreviation "zoo" is.

The above table shows how a person's coming out to their parents has changed their parents' attitudes towards them. Here especially the quantity of data is almost negligible, though thusfar it's looking as though if you're female, you are more likely to see a change for the better than the worse if you tell your parents. If you're male though, the reverse seems true, with more than twice as many males seeing a change for the worse than for the better.
Zoophilia/bestiality in family background
This was perhaps the strangest of all the questions here, though also one of the most direct, looking specifically at how hereditary zoophilia or bestiality is. Be this by genetics or by learning and exposure (one person I recall talks of how she as a child 'held the bag of doggie cum' for her parents, who bred dogs). As such, it is one of the most relevant questions. The results are summarised in the following table.

Alas here again, there is no model data to compare to, and it seems highly improbable that such data can be collected. However, data HAS been collected that shows what percentage of the population is involved in bestiality, by an organisation called Survey. Net. This data indicates 11% of 'net users are curious about bestiality, 5.6% are "mildly involved", and a further 4.4% are "heavily involved". (Survey.net 2000)
At first this data would indicate that a far larger amount of zoophilia or bestiality should be prevalant within a family than the table above suggests. However, given that only 16.1% of respondents to this survey have told their parents of their zoophilia, it would seem a great number of zoophiles exist in families with a history of zoophilia or bestiality, and are oblivious of the fact. It was only after I came out to my parents that I discovered I had a grandfather who might have been involved in bestiality.
A graph showing the portion of respondents who are aware of zoophilia or bestiality in their family. I cannot make any quantitative statements from here, because the error margins for all the figures I am working with so far are too great. So unfortunately my own interpretations here are inconclusive. However, the graph to the right shows a summary of what portion of respondents to this survey are aware of zoophilia or bestiality existing in their family.

Family's view on animals
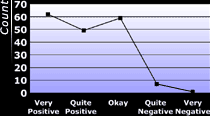
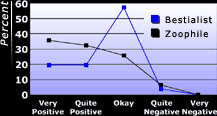
A graph showing respondents' families views on animals. The graph to the right indicates what kind of family attitude to animals respondents perceived. I suspect that this is one of the key factors in defining a person's zoophilia as opposed to bestiality, and this is shown by the graph below where bestialists and zoophiles have been separated. A family background that is very positive towards animals likely instils more in a person just how equal to us animals are, and this is a vital component of being able to have an equal relationship with an animal; that you recognise its sentience and worth.
A graph showing respondents' families views on animals, by sexuality. It's clear from the graph to the right that zoophiles rate higher their family's attitude towards animals, though it's interesting to note that not one respondent selected 'very negative'. I know that I've grown up in a family with a very positive attitude towards animals; I've three Yorkshire Terrier dogs, me and my family's been vegetarian for 14 years now, and I believe I'm quite wholly zoophile.

Pets during childhood

The above table shows the number of pets respondents had during their youth. It seems that female respondents have more pets during their youth than male respondents (82.1% with three or more pets, as opposed to 55% in males), which together with the results from the previous question on family's opinions of animals, perhaps indicates that females are more influenced by their family background.

The graph to the right shows what pets people have in their youth, something that seems to have quite some affect on a person's species preference. The table below shows an analysis of three different animals; dogs, horses and big cats. The portion of people strongly, slightly and not at all attracted to these animals and who had dogs, horses or cats (domestic or big cats) as pets shows a slight but consistent connection between pets in childhood and species preference in later life. The stronger that attraction to the particular species, the more likely it is that person had pets of that species as a child. Where that particular species is not so common a pet, the match seems even clearer; though for birds and sheep the quantity of data is insufficient.
Self-Image

The above table shows the responses to this question by gender. From these figures it's clear that male respondents appear to have a lesser self image of themselves than female respondents, though I suspect this is quite normal.
What was found from analysis of this question is that no single factor seems to have a major impact on self image, though species preference (those attracted to prey animals have a better self image than those attracted to hunter animals), sexual orientation (bestialists have lowest self-image, followed by zoophiles then non-zoophiles) and the number of current pets (respondents with no pets have significantly lower self-image than those with more than three pets) seem to have the greatest impact.
Other factors which have a less significant impact on self image are age and human relationships. Respondents aged below 20 and above 40 seemingly with highest self image, and those at 28 with lowest. Also, respondents in a human relationship are significantly less likely (almost five times so) to rate their self image as negative, and 25% more likely to rate their self image as positive; but I suspect this is quite an obvious point.
It's not clear though which is cause and which is effect for much of this. It's likely that self image affects species attraction, and perhaps if a respondent is in a human relationship or not, but does a self-confident respondent have more pets, or is a respondent with more pets more self-confident? And of course the ultimate question, is a respondent with lower self-confidence more likely to become a bestialist or zoophile, or is it vice-versa?
Current sexual relationships
The first question in this section asked what pets a zoophile currently has. The results are summarised below.

As can be seen from the above data, female zoophiles are far more likely to have pets than their male counterparts, and they are more likely to have more of them. 23.5% of females have four or more pets. This figure for males is only 10.0%. At the same time, only 5.9% of females are likely to have no pets, while a startling 35% of males have no pets of their own!
The second and third questions in this section looked at the sexual relationship zoophiles have with their own animals, and with animals they do not own. The results are again summarised below.

The most notable fact that can be seen from the above information is that there are a great number of zoophiles who have pets, and yet who do not have sexual relationships with them. This is of course somewhat obvious; all zoophiles have some species they they feel the same about as anyone else would. I for example love dogs, but not in a zoophilic sense, simply as pets.
Another interesting point is that 50.0% of males, who we've seen are almost six times less likely than females to have their own pets, have sexual relationships with animals they do not own. Only 33.3% of females on the other hand, who are six times more likely to have pets of their own, have sexual relationships with animals they do not own.
left
A graph showing the portion of male or female respondents in a human relationship. The final questions in this section looked at how zoophiles conduct human relationships. The graph to the right shows what portion of zoophiles are involved in relationships. It is clear that a far higher percent of female zoophiles are also involved in human relationships, in fact almost twice as many. This is reflected in the question on sexual orientation towards the start of this document, which showed that zoo exclusiveness was far higher in males than in females.
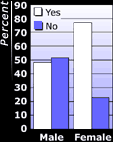
A graph showing the portion of male or female respondents in a human relationship who have told their partner of their sexuality. The graph to the right looks at what portion of those in human relationships have told their partner of their sexuality. The relationship between the portion of those in a relationship and the portion of those people who have told their partner seems rather startling, tough! A four fifths of females are in relationships, and four fifths of those in a relationship have told their partner! Exactly the same is true of males, though the figure becomes three fifths.
Current social relationships

The table above shows what portion of males and females know other zoophiles in real life (not via the 'net), and how many. It's interesting to note that males seem to socialise more with zoophiles in real life than females. This could be because most zoophiles today meet in real life having already met via the 'net, which is a medium used predominantly by males. It stands to reason therefore that with fewer females online, those that are less likely to meet other females. However, I should point out that since the last survey this has become less obvious.
Another point that seems odd is just how many people do not know any zoos in real life, 52.5% of respondents. Until only a few months ago I fell into this category myself, but still I would have expected this figure to be lower than it is.

This table indicates what portion of male and female respondents know other bestialists in real life, and how many. It appears that fewer respondents know other bestialists in real life than they do zoophiles, something that is unremarkable as it follows with the earlier question pertaining to sexual orientation. Though it is important to note here that the definition of bestialist and zoophile are both subjective.
The final question from this survey concerned how popular respondents perceived themselves to be. The results follow.

Looking at the above data it's difficult to see anything particularly remarkable. Also, this kind of question really does need model information to be compared to. One thing that can be discerned is that male respondents seem to deem themselves less popular than females. Whether this is merely a tainted perception or reality I can't determine without some model data.
This article is the very nice work of Muse's Zoo Research and can be read here in it's full context.